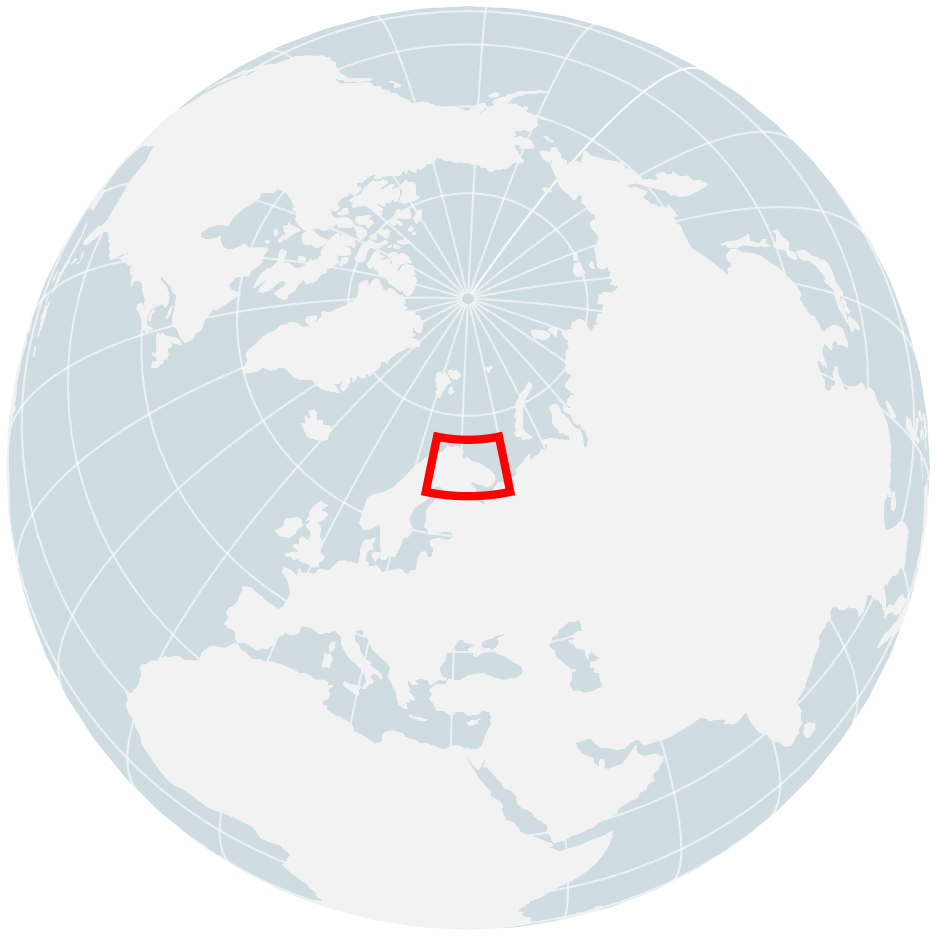
Wind power capacity factor comparison at 0.1° resolution for the Norwegian/Barents Sea in July 2024 (summer). Summer counterpart to the winter wind power analysis.
2024 Norwegian Sea Wind Summer
Wind Energy | Europe
2024-07-01 to 2024-07-31
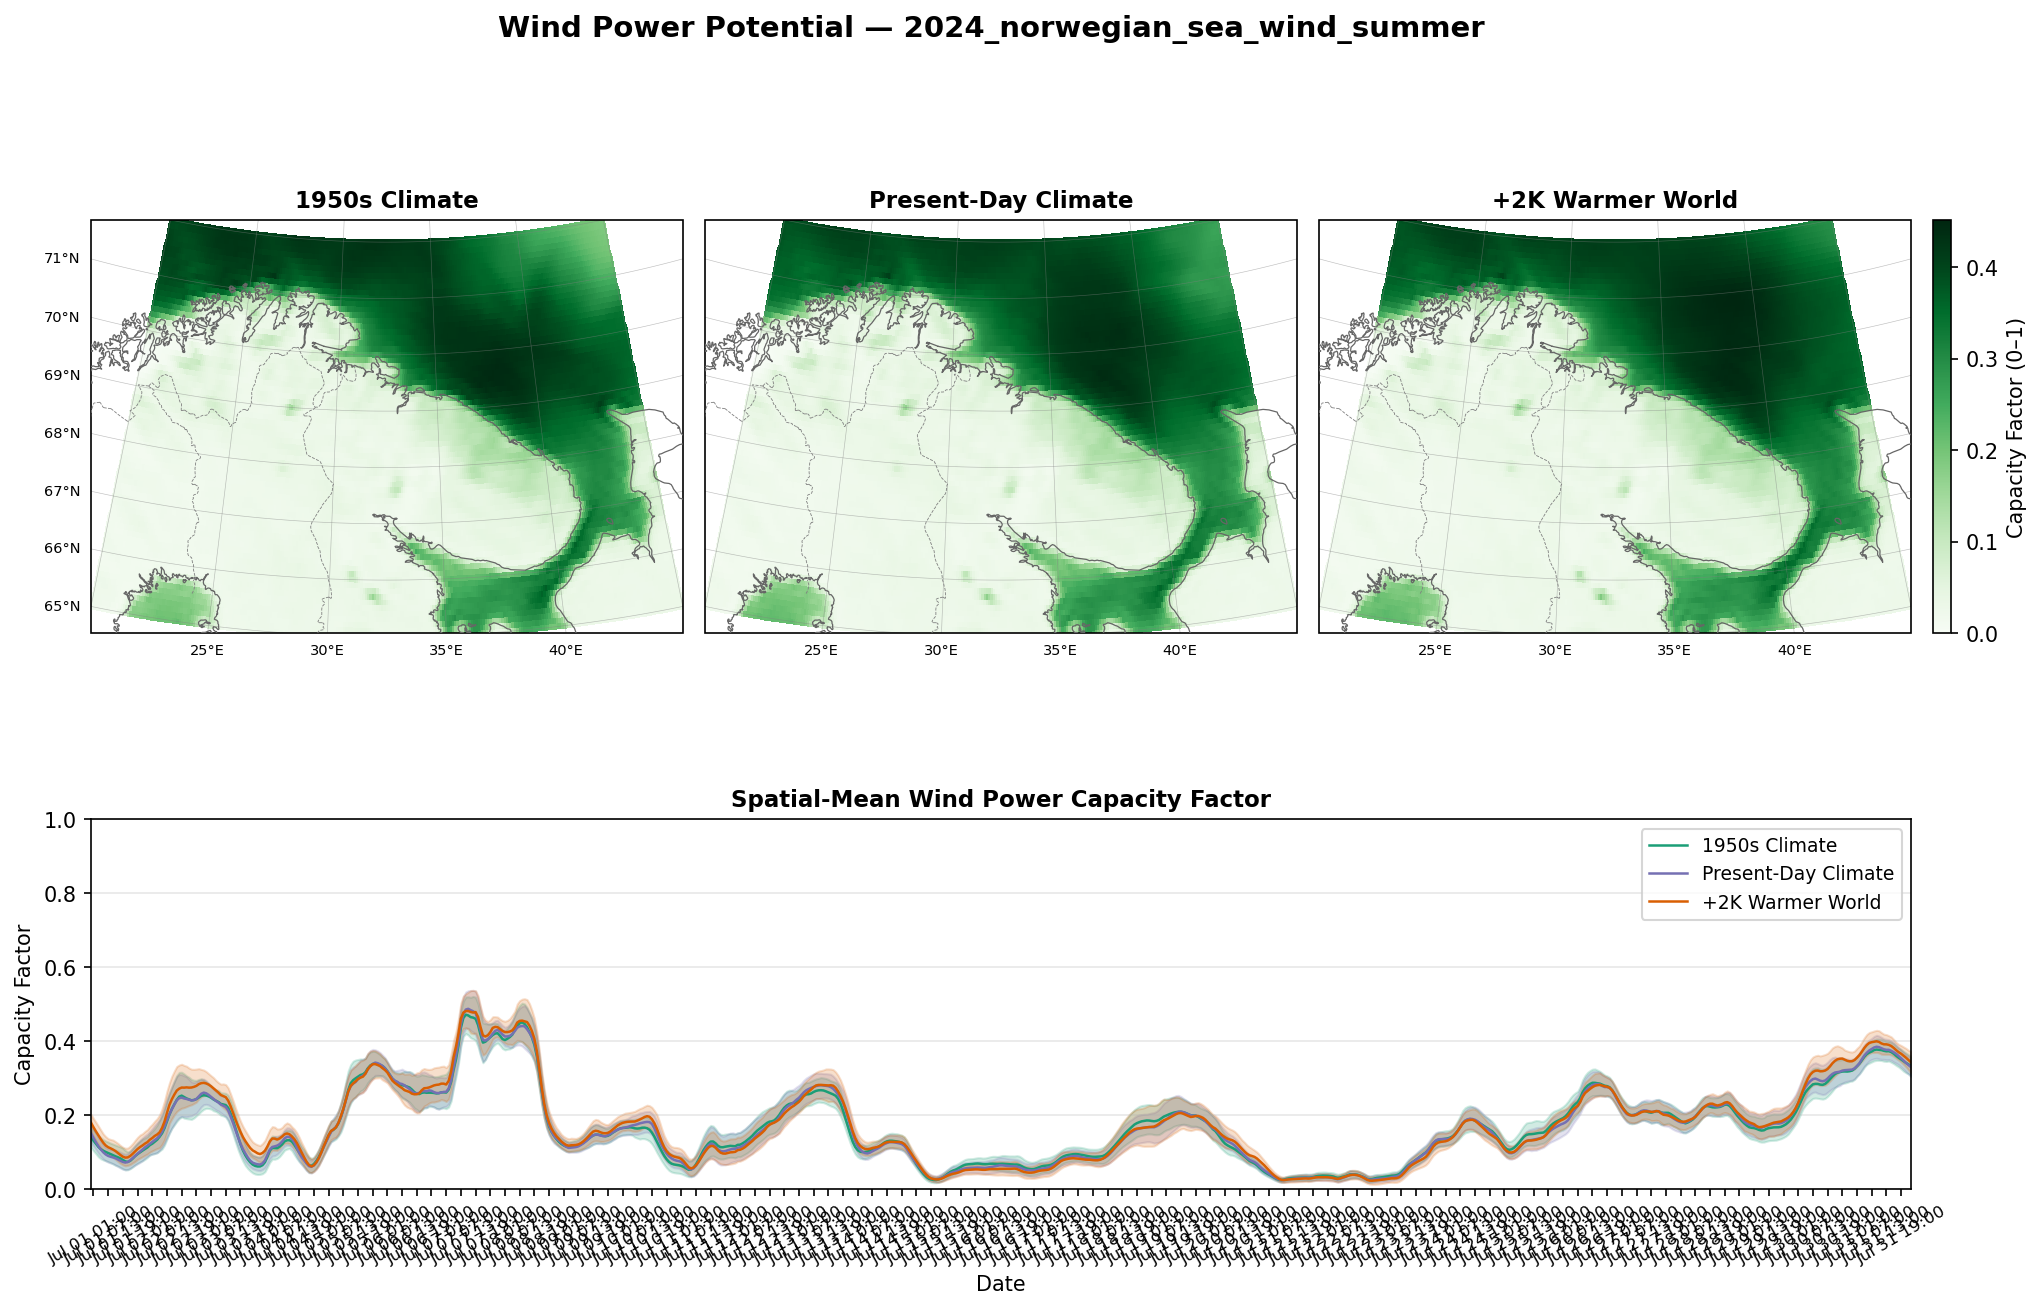
Wind Power Potential — Norwegian Sea Summer (Jul 2024, 0.1°)
Key Findings
- Summer capacity factors are much lower (mostly 0.1–0.4) compared to winter (0.3–0.8).
- The three scenarios are tightly clustered, with less differentiation than in winter.
- Wind power differences between scenarios are smaller than wind speed differences because summer winds often fall below rated speed, in the gentler part of the power curve.
- The maps show lower overall capacity factors with less spatial contrast than winter.
- For wind energy planning, summer scenario uncertainty is less critical because summer contributes less to annual energy output in this region.
Scientific Context
The muted summer wind power signal has two causes: (1) the thermodynamic forcing differences between scenarios are weaker in summer (less Arctic amplification effect on the meridional gradient), and (2) summer wind speeds sit lower on the turbine power curve where the cubic amplification is less pronounced. Together, these effects mean that climate scenario impacts on Norwegian Sea wind power are predominantly a winter phenomenon.
Seasonal Contrast
Direct comparison with winter (Jan 2025): winter peak capacity factors are ~2x higher, and scenario separation is clearly visible during storm events. Summer shows a flatter, more uniform time series with the three scenarios nearly overlapping. Annual wind energy projections under different climate scenarios would be dominated by the winter signal.
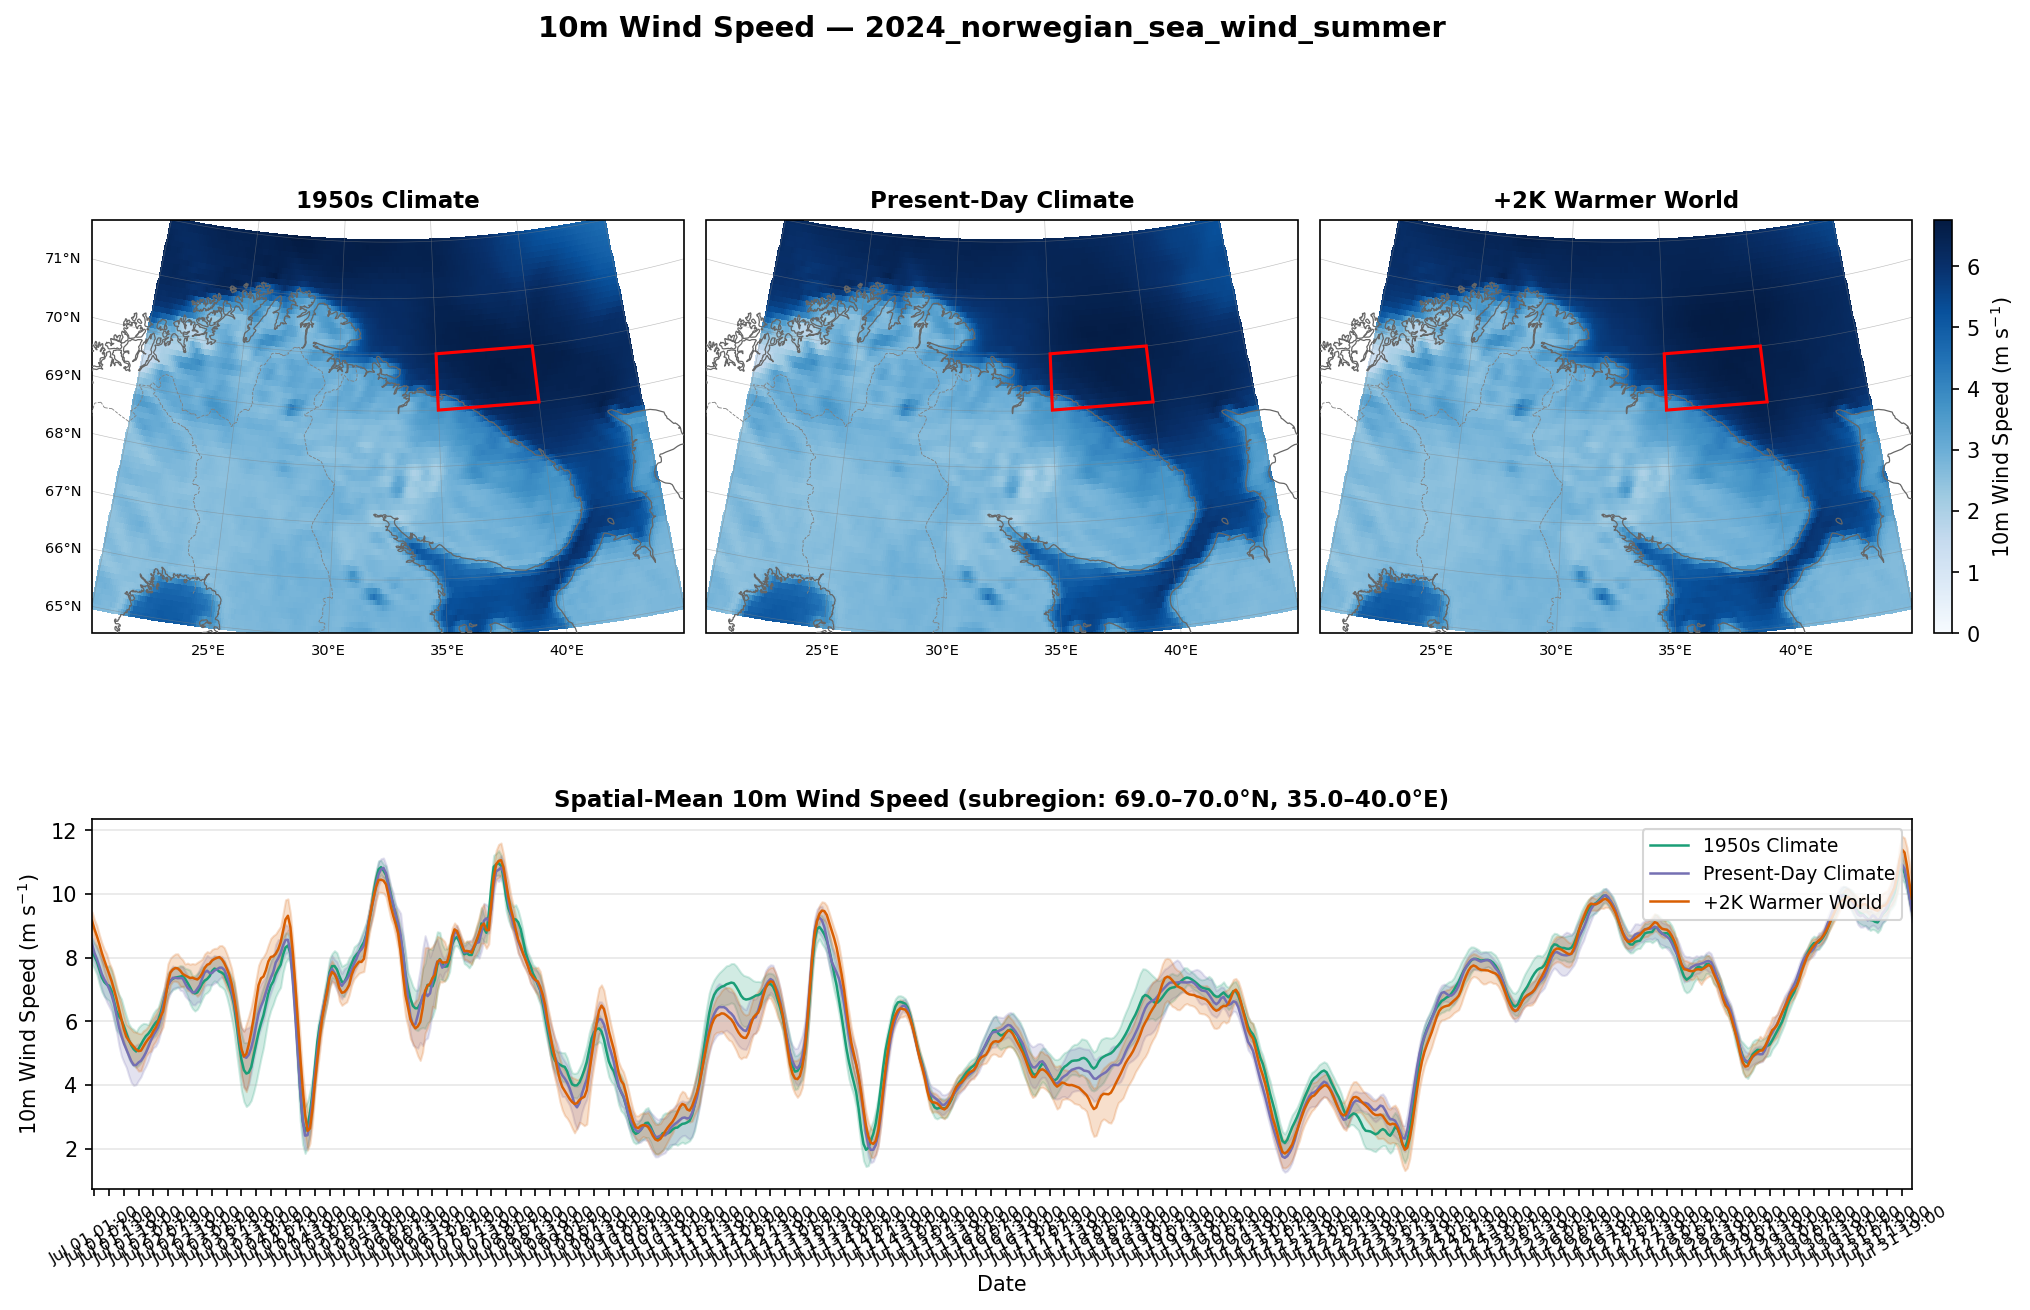
Wind Speed Box35 40 69 70
Image file:
wind_speed-box35_40_69_70.png
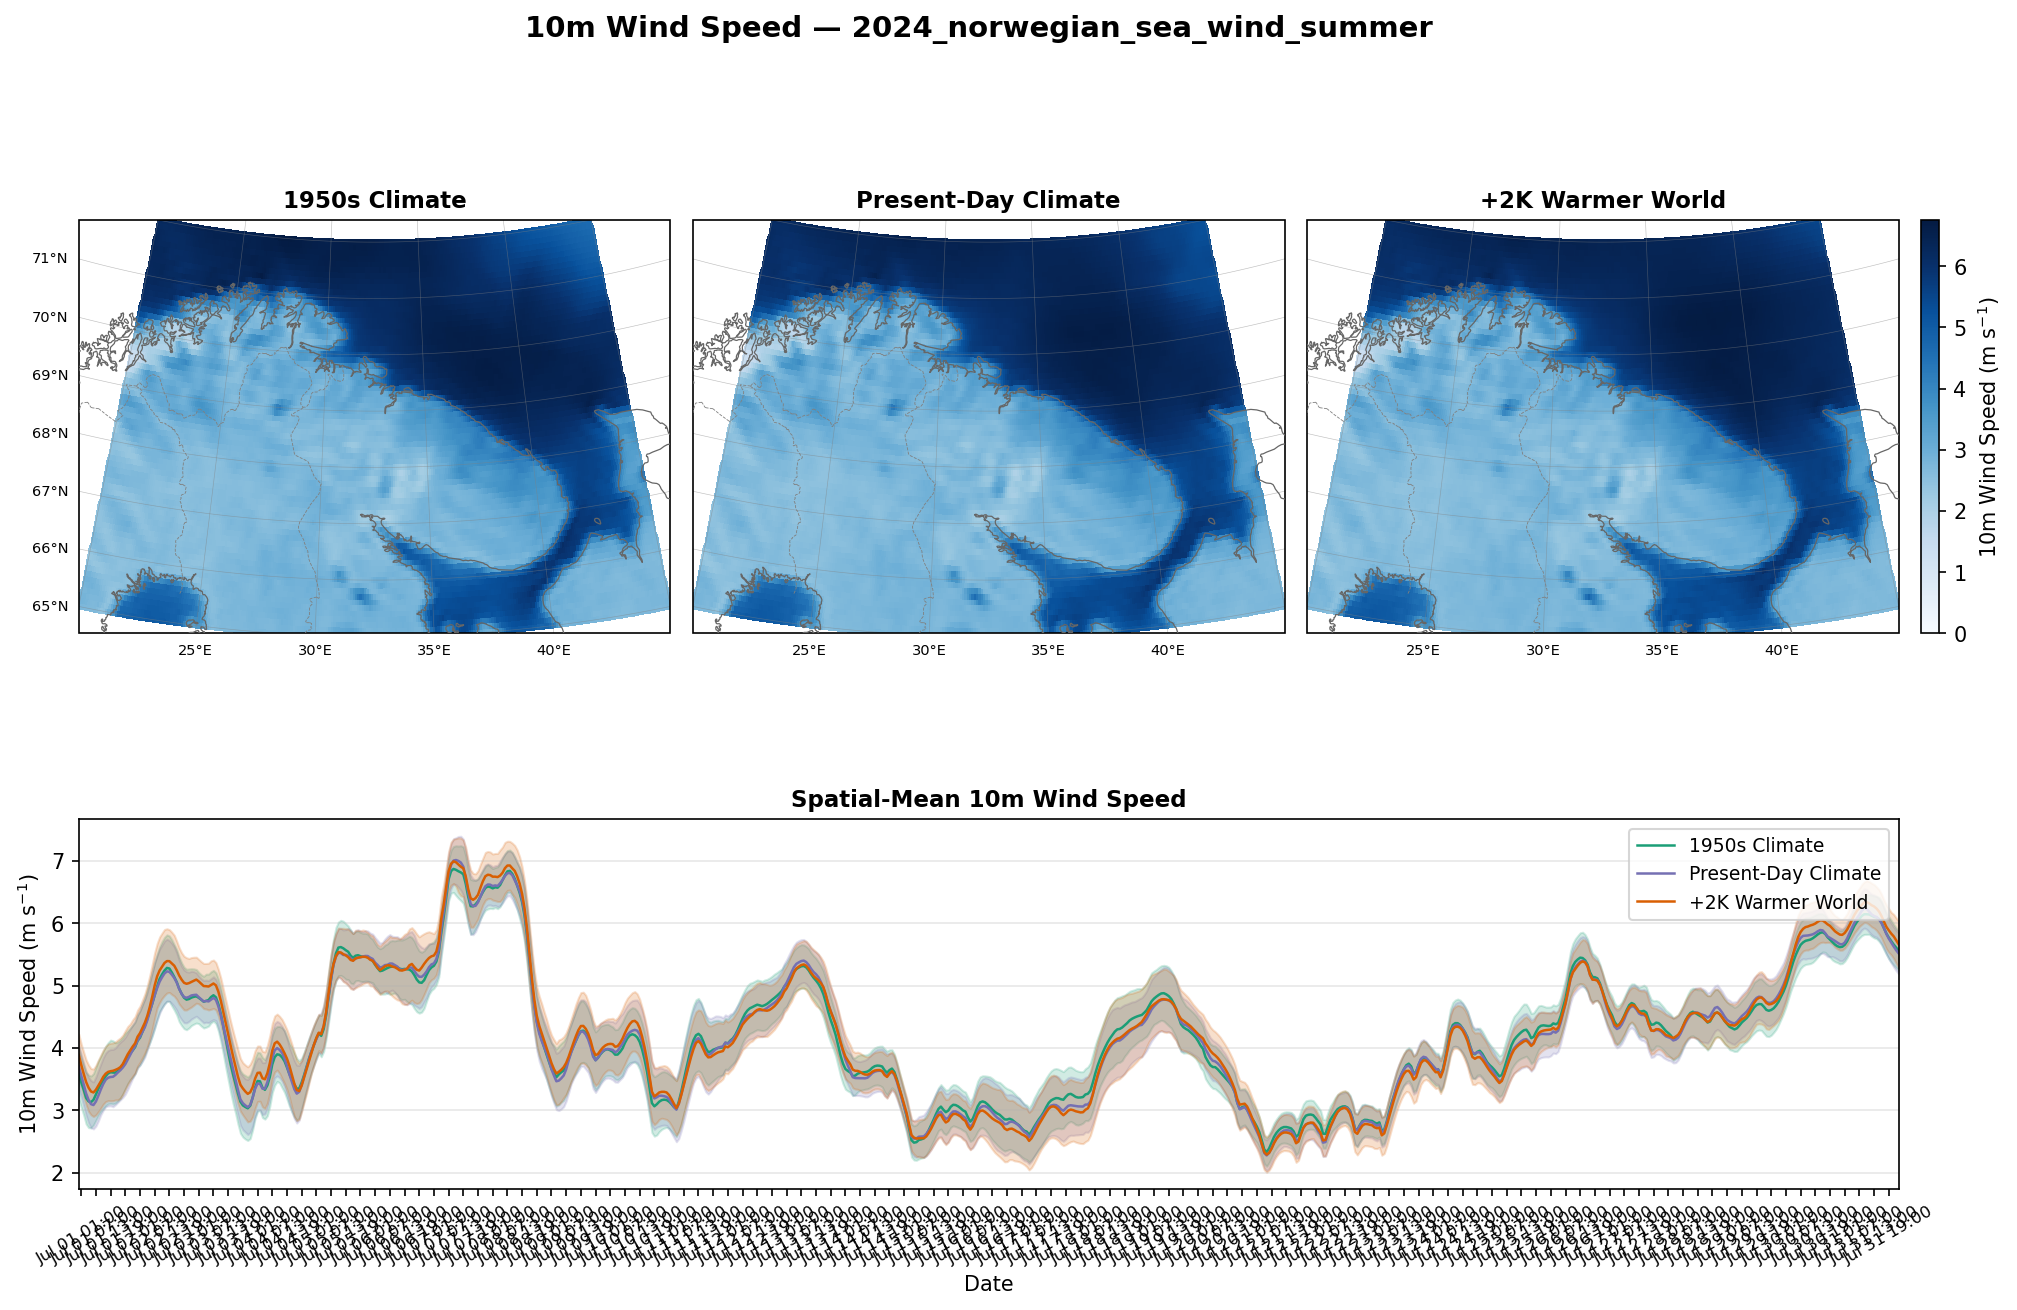
10m Wind Speed — Norwegian Sea Summer (Jul 2024, 0.1°)
High-resolution (0.1°) hourly 10m wind speed comparison for the Norwegian/Barents Sea in July 2024. Summer counterpart to the January 2025 winter analysis, designed to reveal seasonal differences in scenario sensitivity.
Key Findings
- Summer wind speeds are lower (3–7 m/s) compared to winter (5–10 m/s).
- Scenario spread is still visible but less pronounced than in winter.
- The ensemble spread (shading) is wider relative to the scenario differences compared to winter, indicating more internal variability and less robust scenario signal.
- Despite less clear separation in the spatial mean, individual periods show notable divergence between scenarios.
- The smoother time series reflects weaker synoptic forcing in summer, with fewer sharp storm peaks.
Scientific Context
In summer, the reduced meridional temperature gradient (which warming weakens further) is already weaker than in winter, so the baseline for scenario differentiation is smaller. Additionally, summer boundary layers are more convectively driven and less directly coupled to large-scale pressure gradients, introducing more local variability that is harder to attribute to scenario differences. The weaker summer signal is expected and consistent with the Arctic amplification mechanism being most effective in winter.
Seasonal Contrast
Comparing this plot with the January 2025 winter analysis reveals the strong seasonality of climate scenario impacts on surface winds. Winter shows clear, robust scenario ordering; summer shows more overlap and uncertainty. This has direct implications for wind energy: winter capacity differences between scenarios are both larger and more reliable.