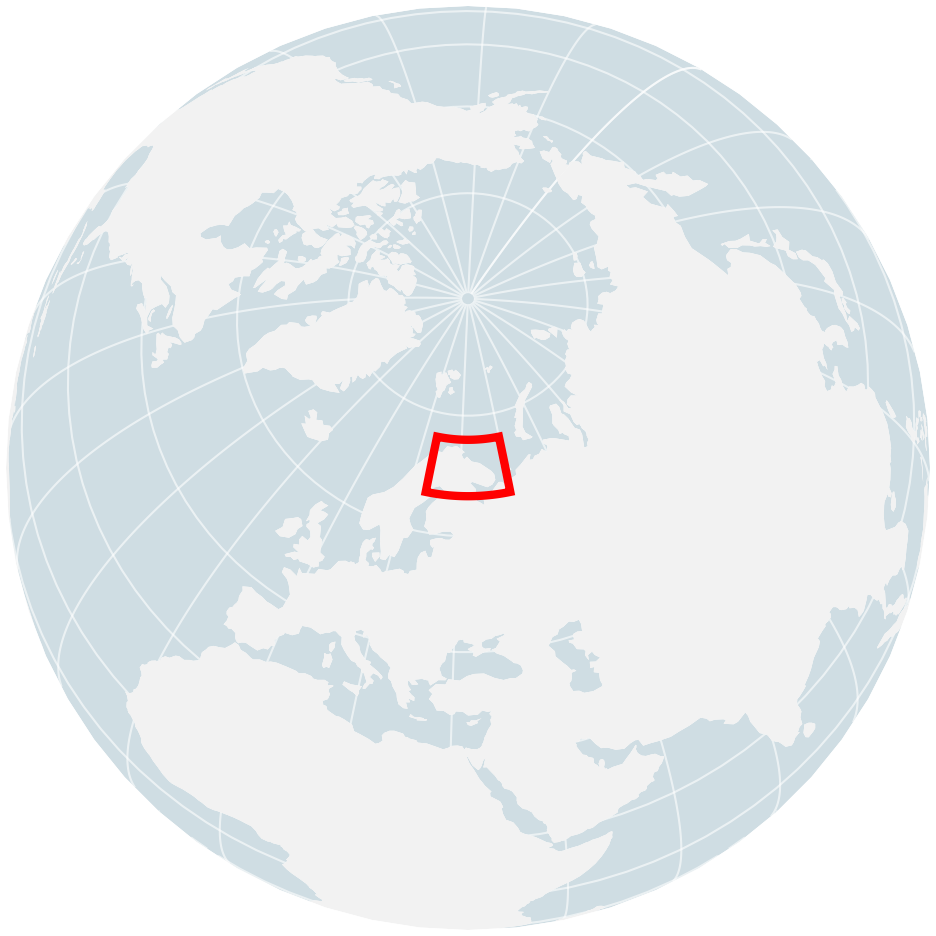
Wind power capacity factor comparison at 0.1° resolution for the Norwegian/Barents Sea in January 2025 (winter). Capacity factor is computed from 10m wind speed using a generic wind turbine power curve.
2025 Norwegian Sea Wind Winter
Wind Energy | Europe
2025-01-01 to 2025-01-31
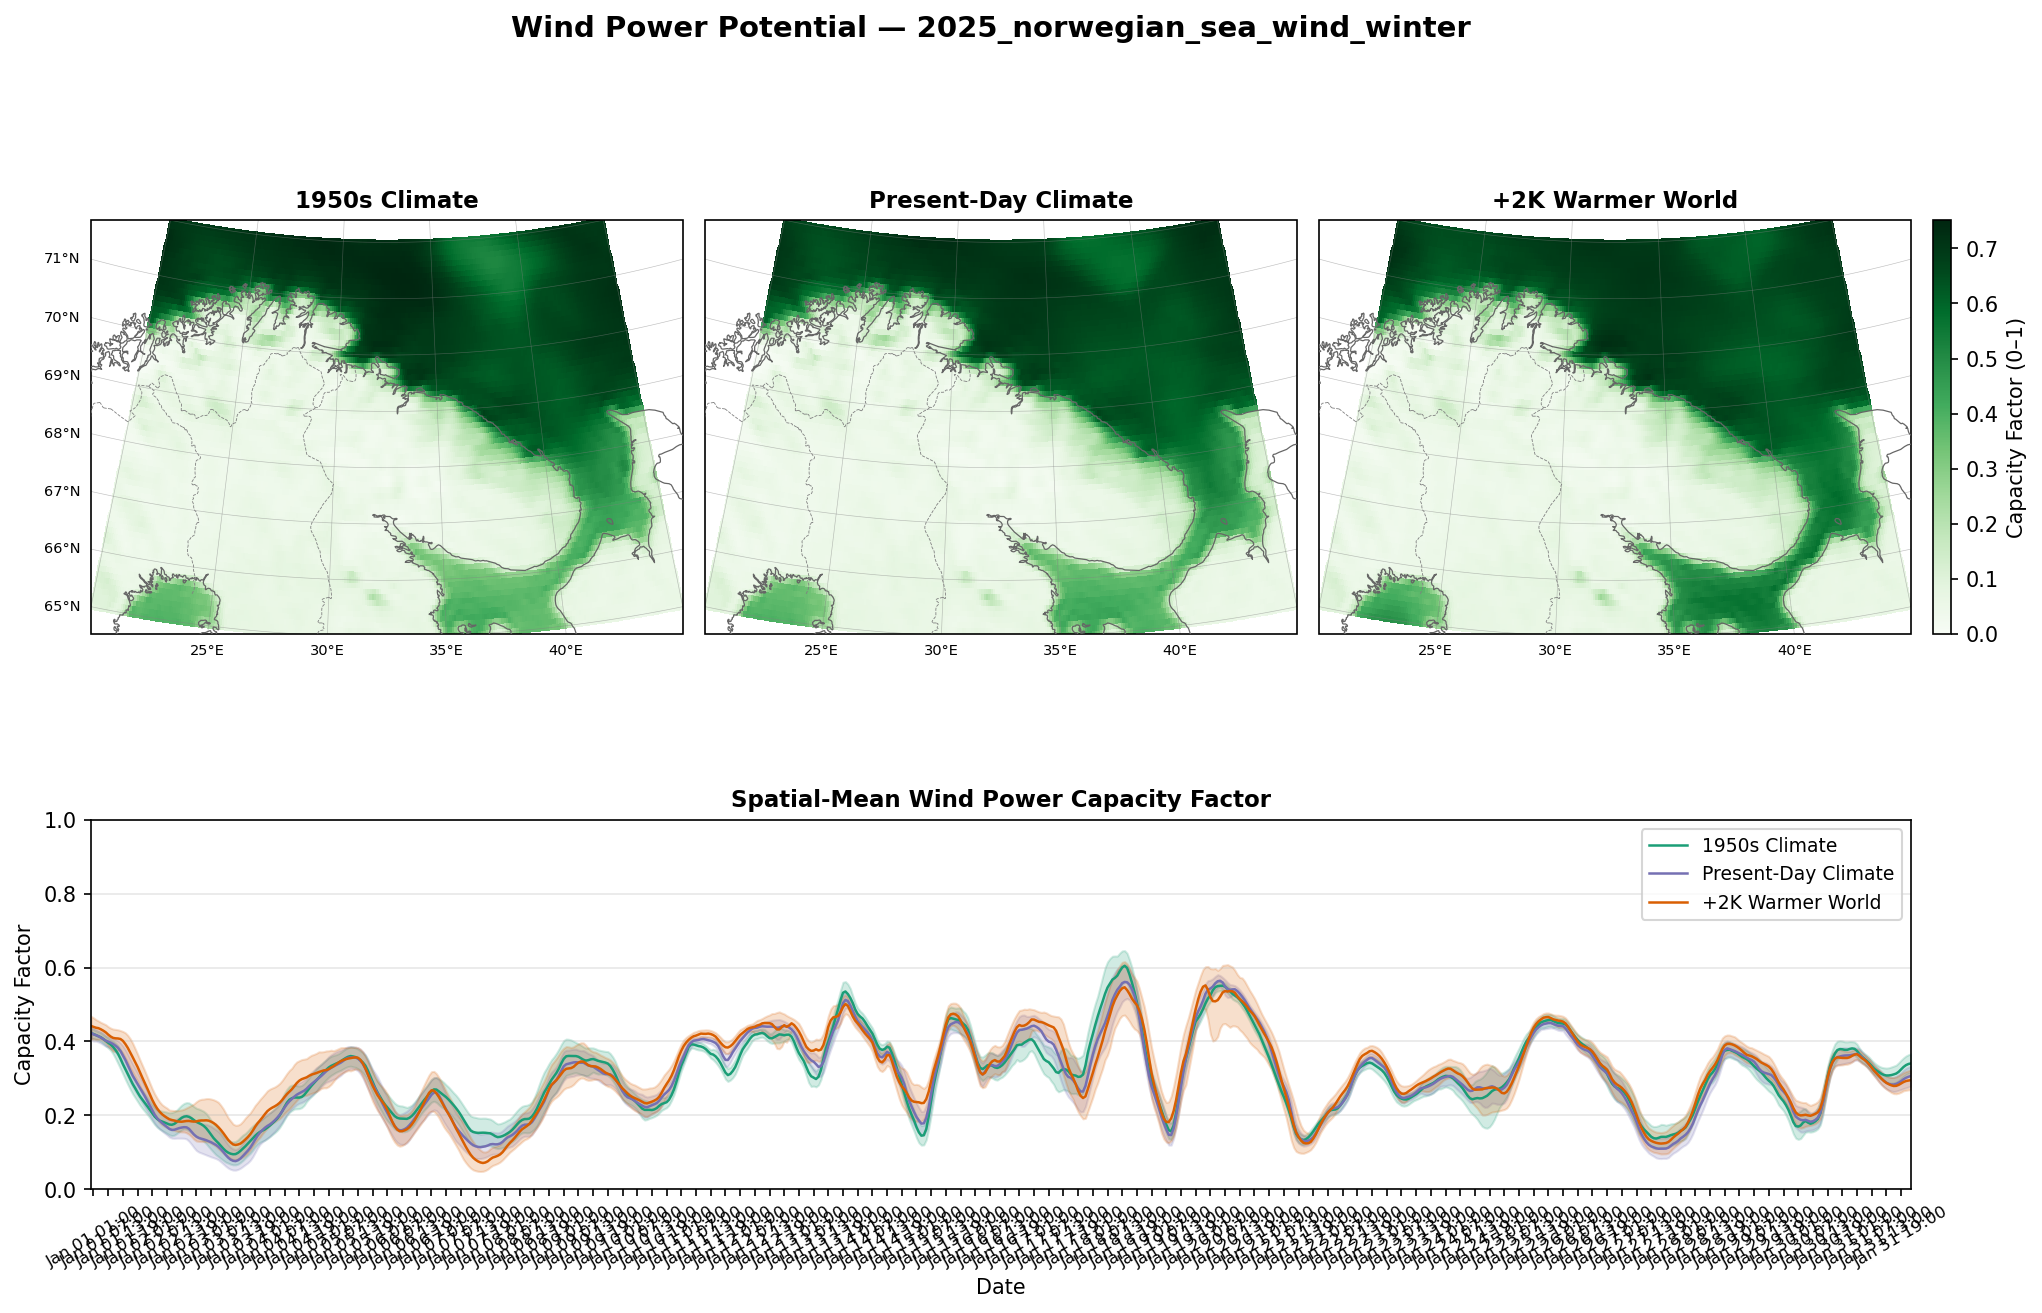
Wind Power Potential — Norwegian Sea Winter (Jan 2025, 0.1°)
Key Findings
- Winter capacity factors reach 0.6–0.8 during storm peaks, with clear scenario separation.
- Counterfactual (1950) consistently produces the highest wind power, +2K the lowest.
- The capacity factor maps show highest values along the Norwegian coast and over the open Barents Sea.
- Scenario differences in wind power are amplified relative to wind speed differences due to the cubic relationship between wind speed and power at moderate speeds.
- Wind power planning in the Norwegian/Barents Sea may need to account for an estimated 10–15% reduction in winter peak capacity under +2K warming relative to present day.
Scientific Context
Wind power is proportional to the cube of wind speed (P ~ v³), so even small changes in wind speed translate to larger changes in energy output. In winter, when winds are strong and sit in the steep part of the turbine power curve, scenario differences are amplified. The ordering (1950 > present > +2K) reflects the progressive weakening of the meridional temperature gradient with warming, reducing baroclinic wind forcing at high latitudes.
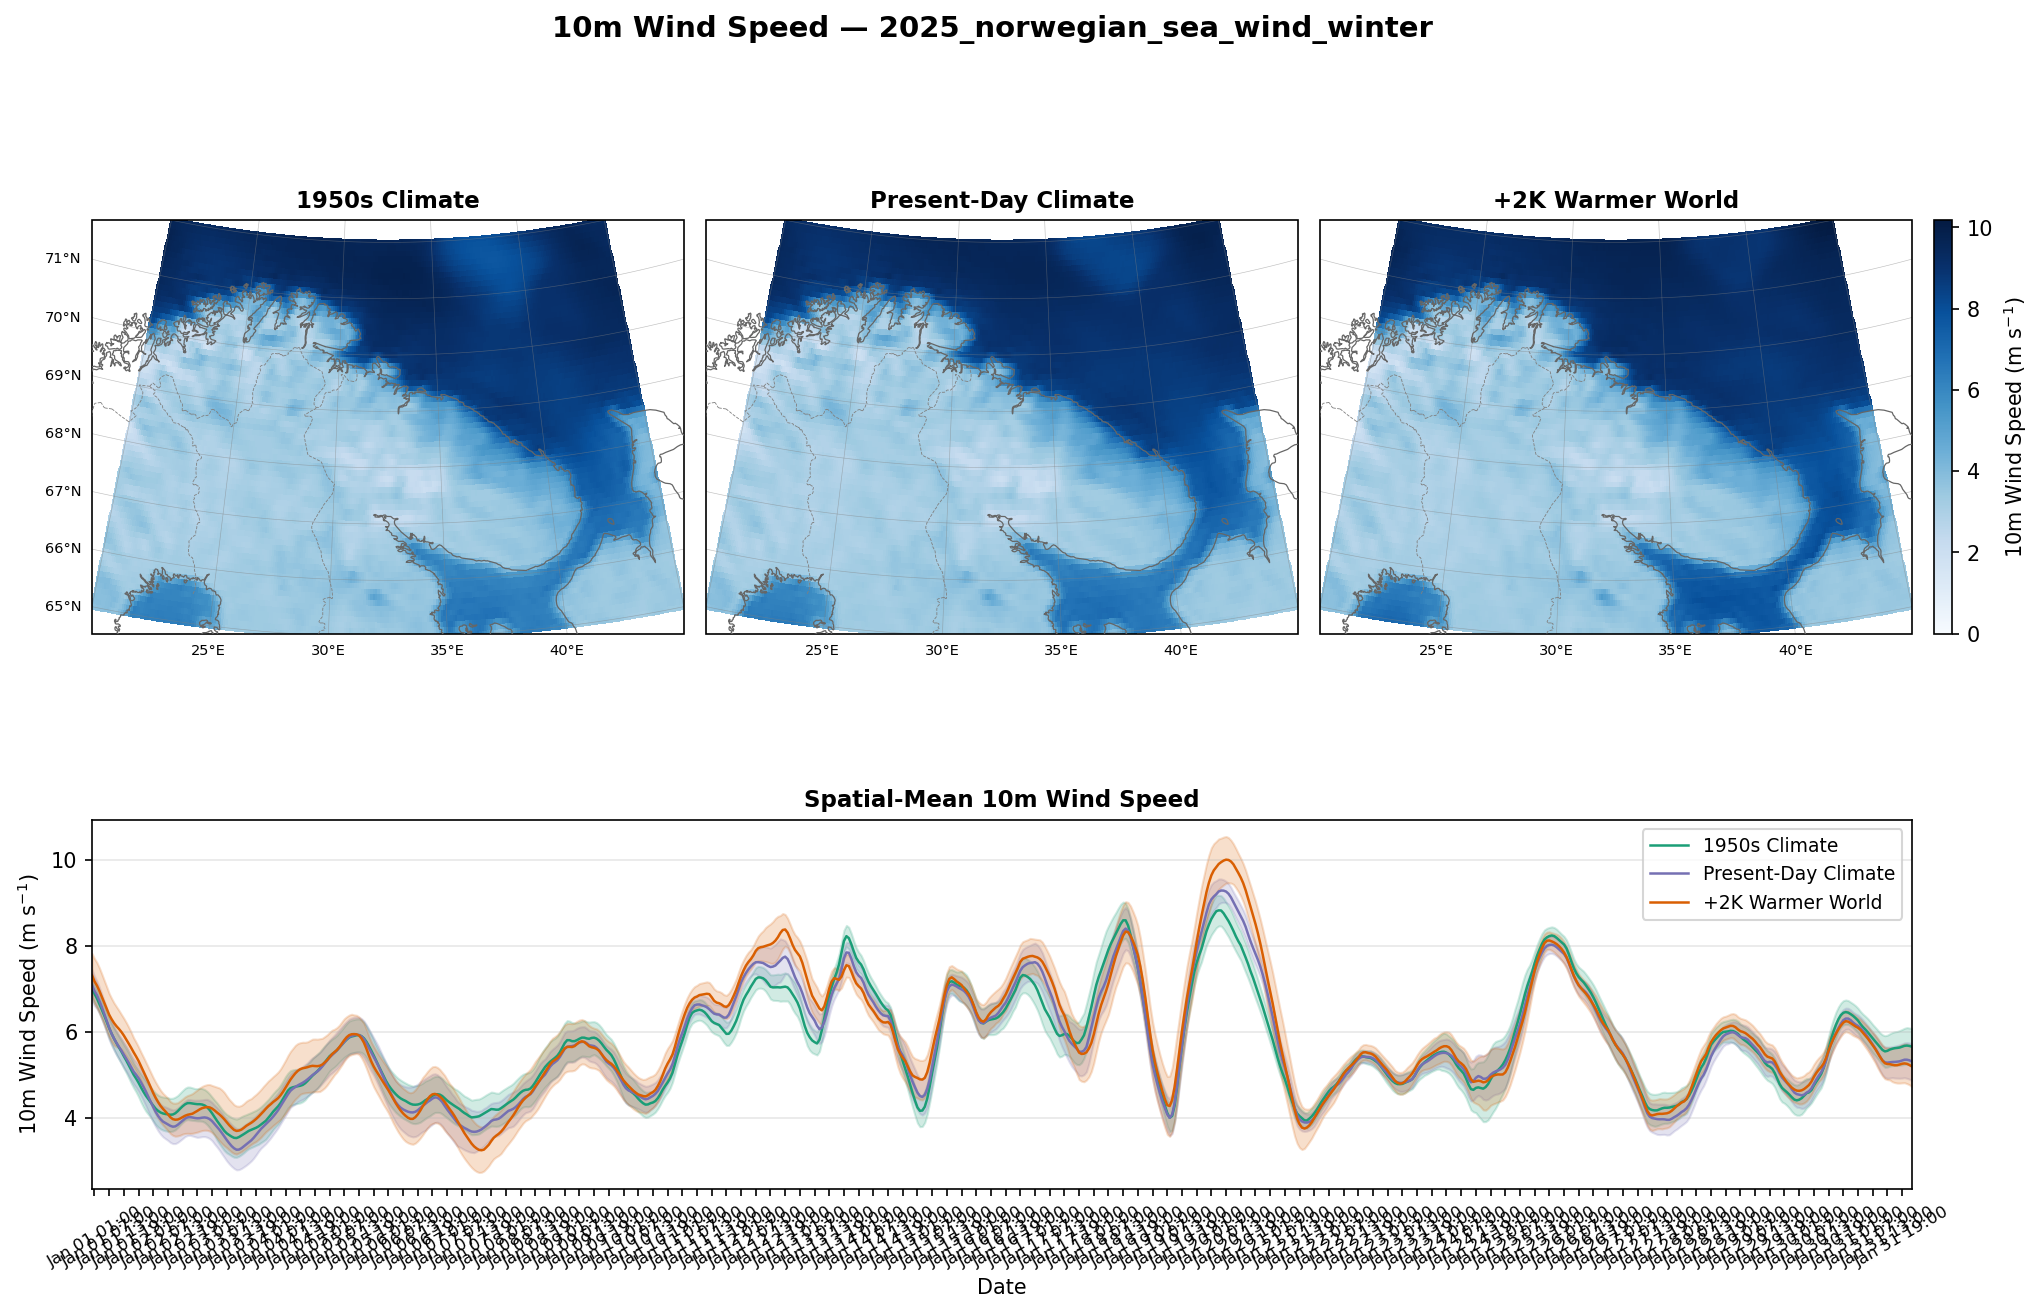
10m Wind Speed — Norwegian Sea Winter (Jan 2025, 0.1°)
High-resolution (0.1°) hourly 10m wind speed comparison for the Norwegian/Barents Sea in January 2025. The high resolution reveals fine-scale coastal features including fjords and the offshore wind speed gradient.
Key Findings
- The Norwegian coastline and fjords are clearly resolved at 0.1°, showing strong land-sea contrasts in wind speed.
- Wind speeds increase sharply offshore, reaching 8–10 m/s over open water during storm events.
- Scenario ordering is consistent with the 1° analysis: counterfactual > historical > +2K during storm peaks.
- Ensemble spread remains tight relative to scenario differences, confirming robustness of the signal at high resolution.
- The spatial detail reveals that scenario differences are largest over the open ocean, not along the coast where surface roughness dominates.
Scientific Context
At 0.1° resolution (~10 km), the model resolves mesoscale features including coastal jets, orographic effects along the Norwegian coast, and fine-scale SST gradients. The scenario differences are primarily driven by large-scale thermodynamic changes (Arctic amplification weakening the meridional gradient), but the high resolution reveals where these differences manifest most strongly in the real coastal geography.
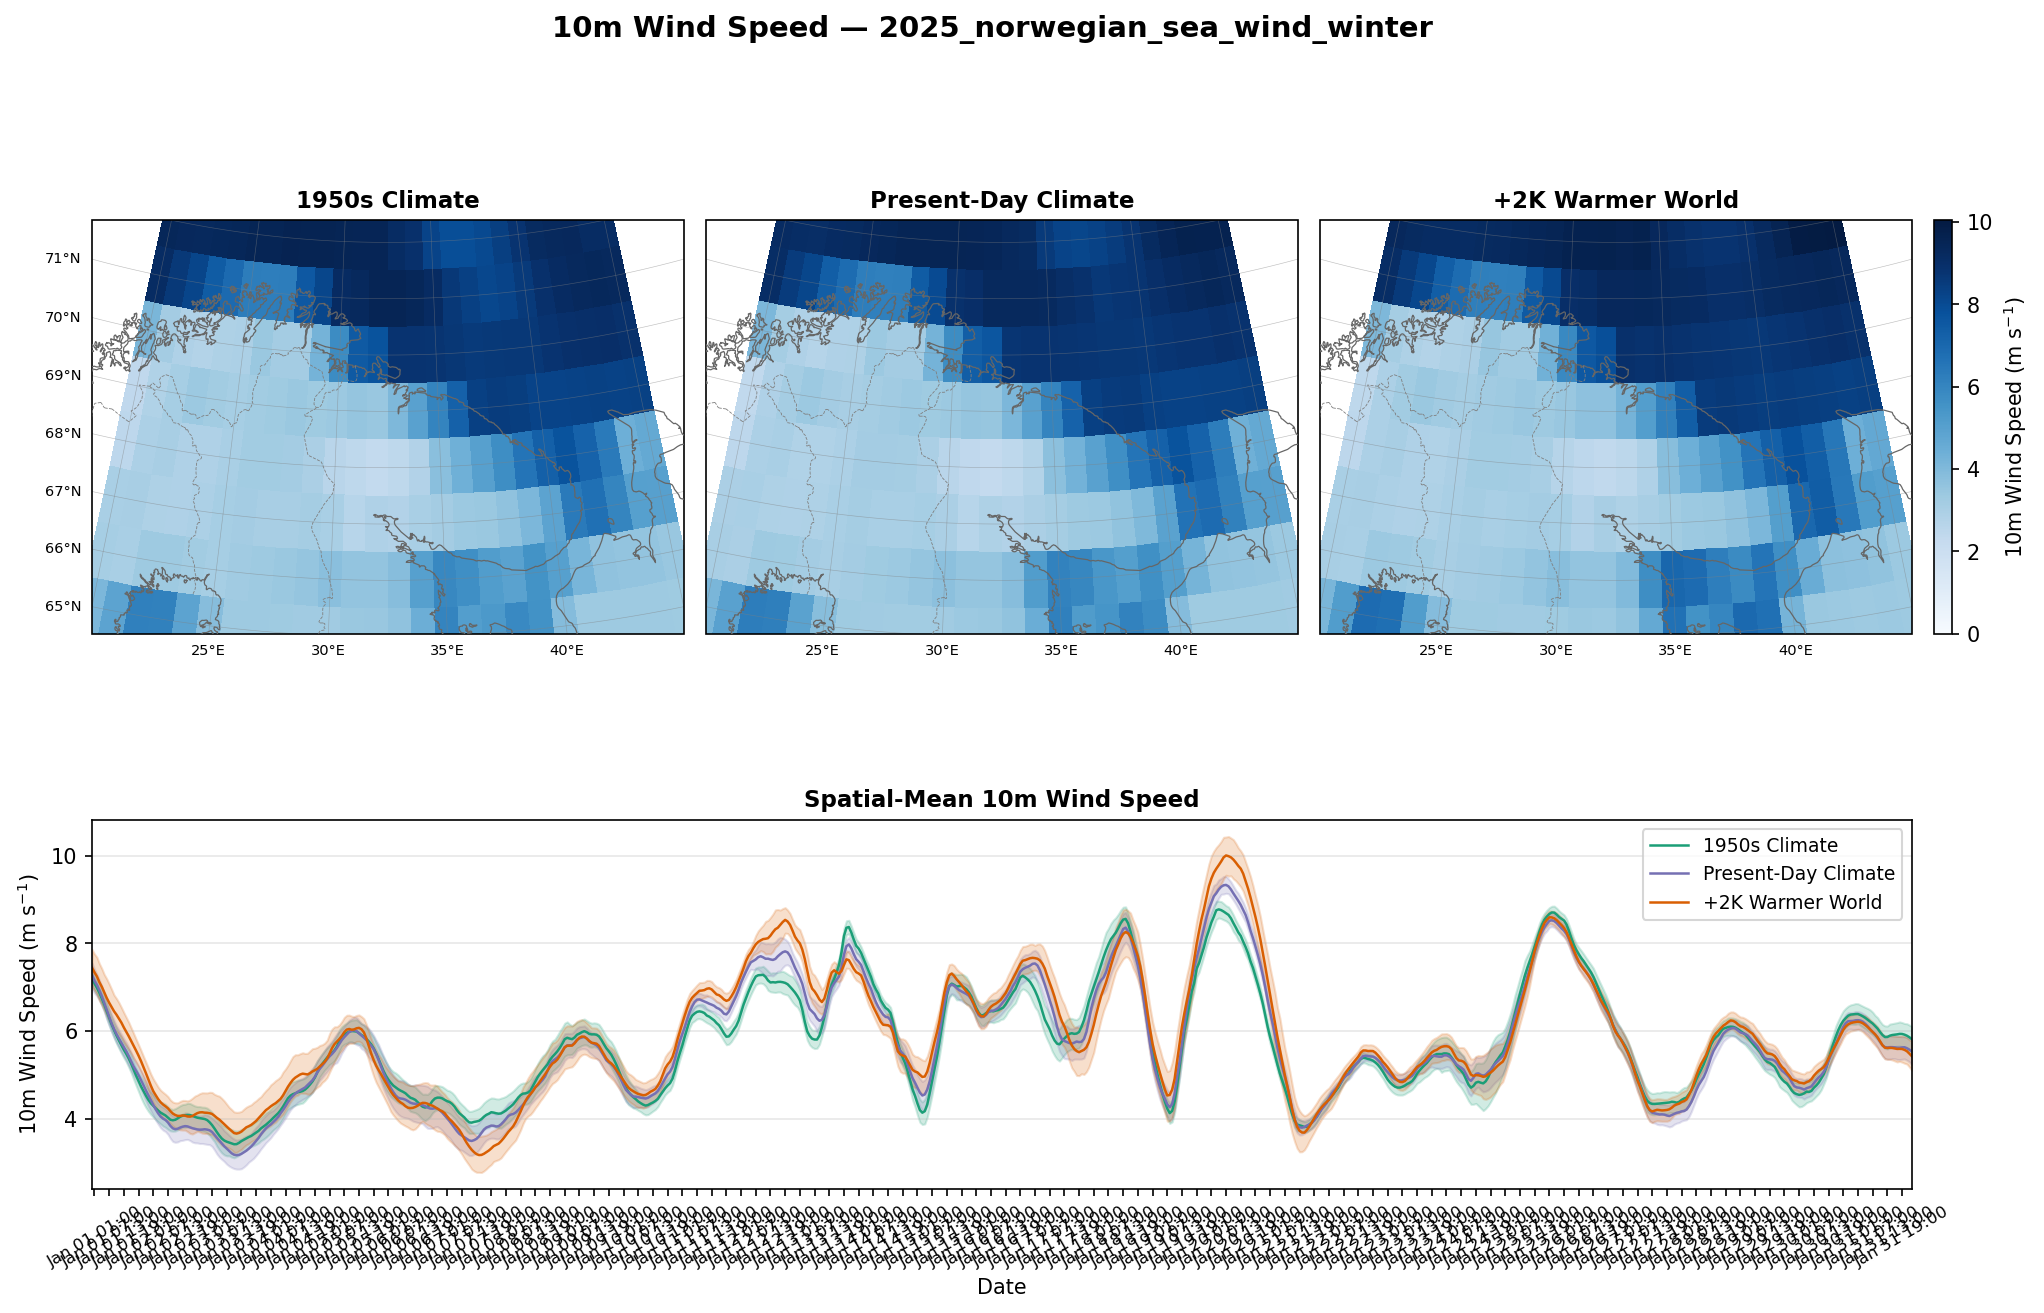
10m Wind Speed — Norwegian Sea Winter (Jan 2025, 1.0°)
Hourly 10m wind speed comparison at 1° resolution across three storyline scenarios for the Norwegian/Barents Sea in January 2025. This region and period were selected as the strongest +2K−Historical signal from the monthly diagnostic.
Key Findings
- Clear scenario ordering during storm peaks: counterfactual (1950) > historical > +2K warming.
- Wind speeds reach 8–10 m/s during peaks, with visible scenario separation.
- Ensemble spread is relatively tight compared to inter-scenario differences, suggesting the signal is robust.
- The domain is mostly ocean, limiting spatial detail in the maps at 1° resolution.
Scientific Context
In a +2K world, Arctic amplification reduces the pole-to-equator temperature gradient, weakening baroclinic instability and surface wind speeds at high latitudes. The counterfactual (1950) scenario, with more extensive sea ice and a steeper meridional gradient, produces the strongest surface winds. This is a direct thermodynamic effect visible despite the nudged large-scale circulation.