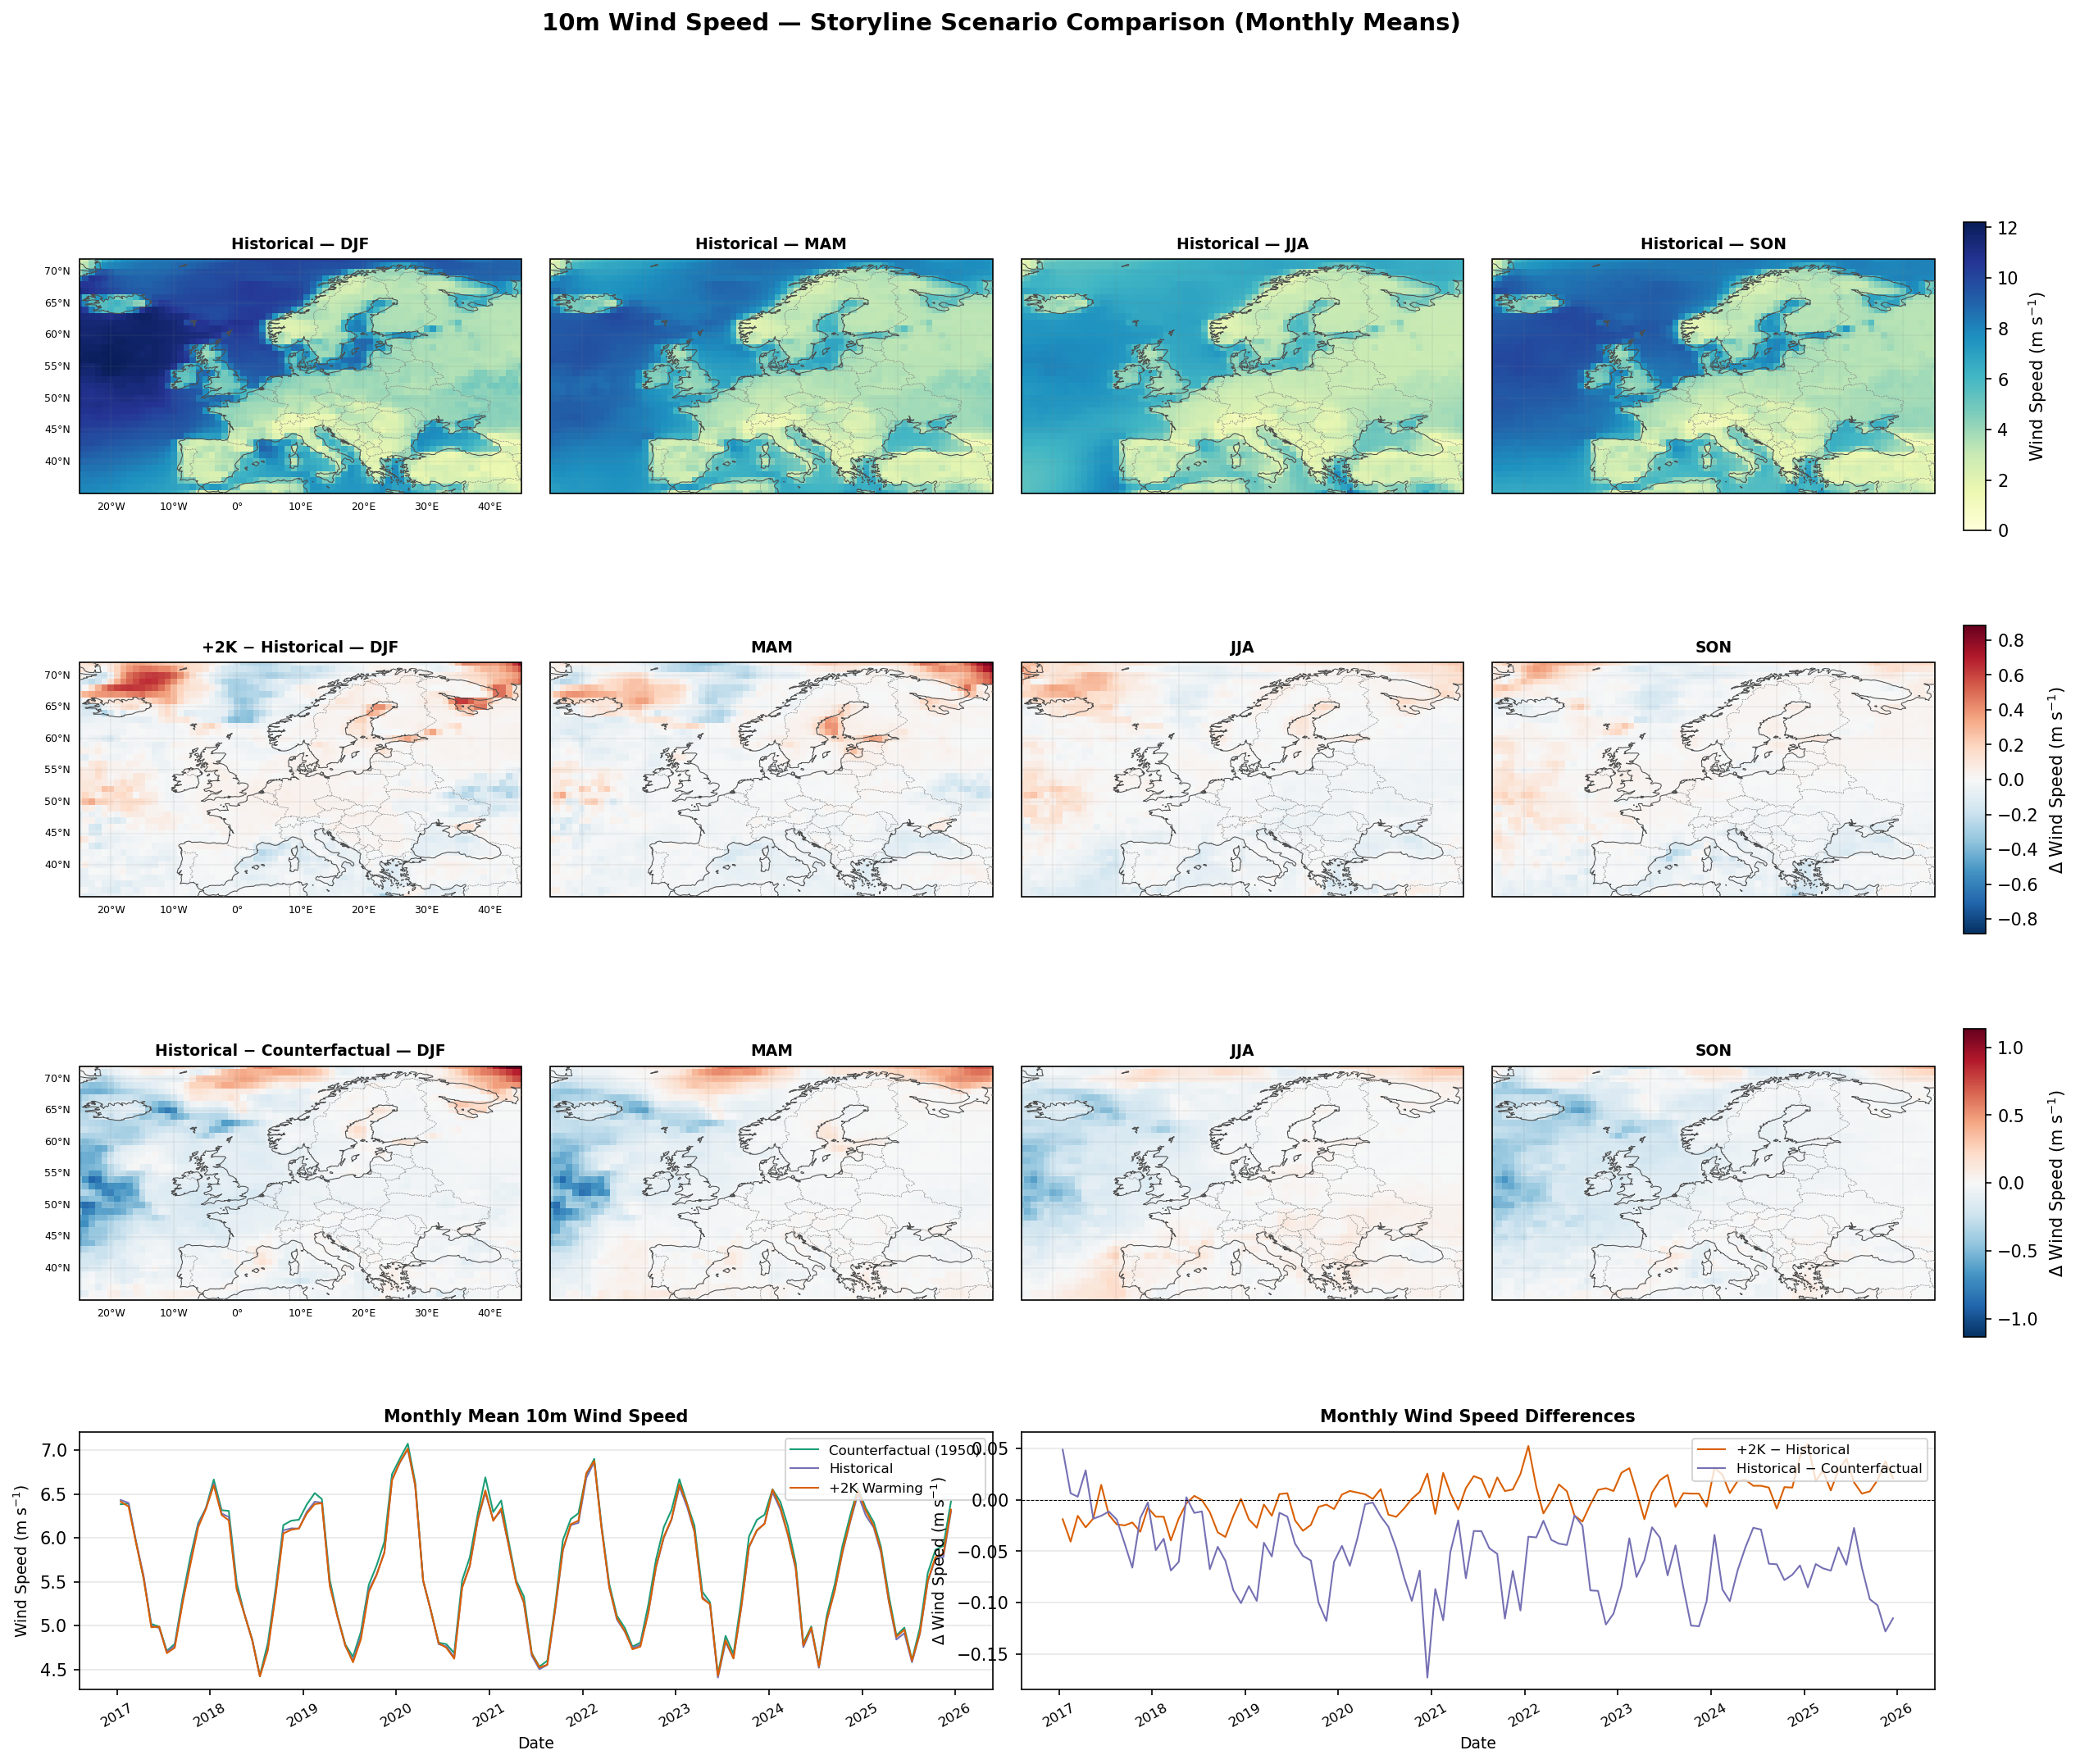
Cross-event analysis and diagnostics for the Wind Energy category.
These plots compare scenarios across the full simulation period rather than focusing on a single event.
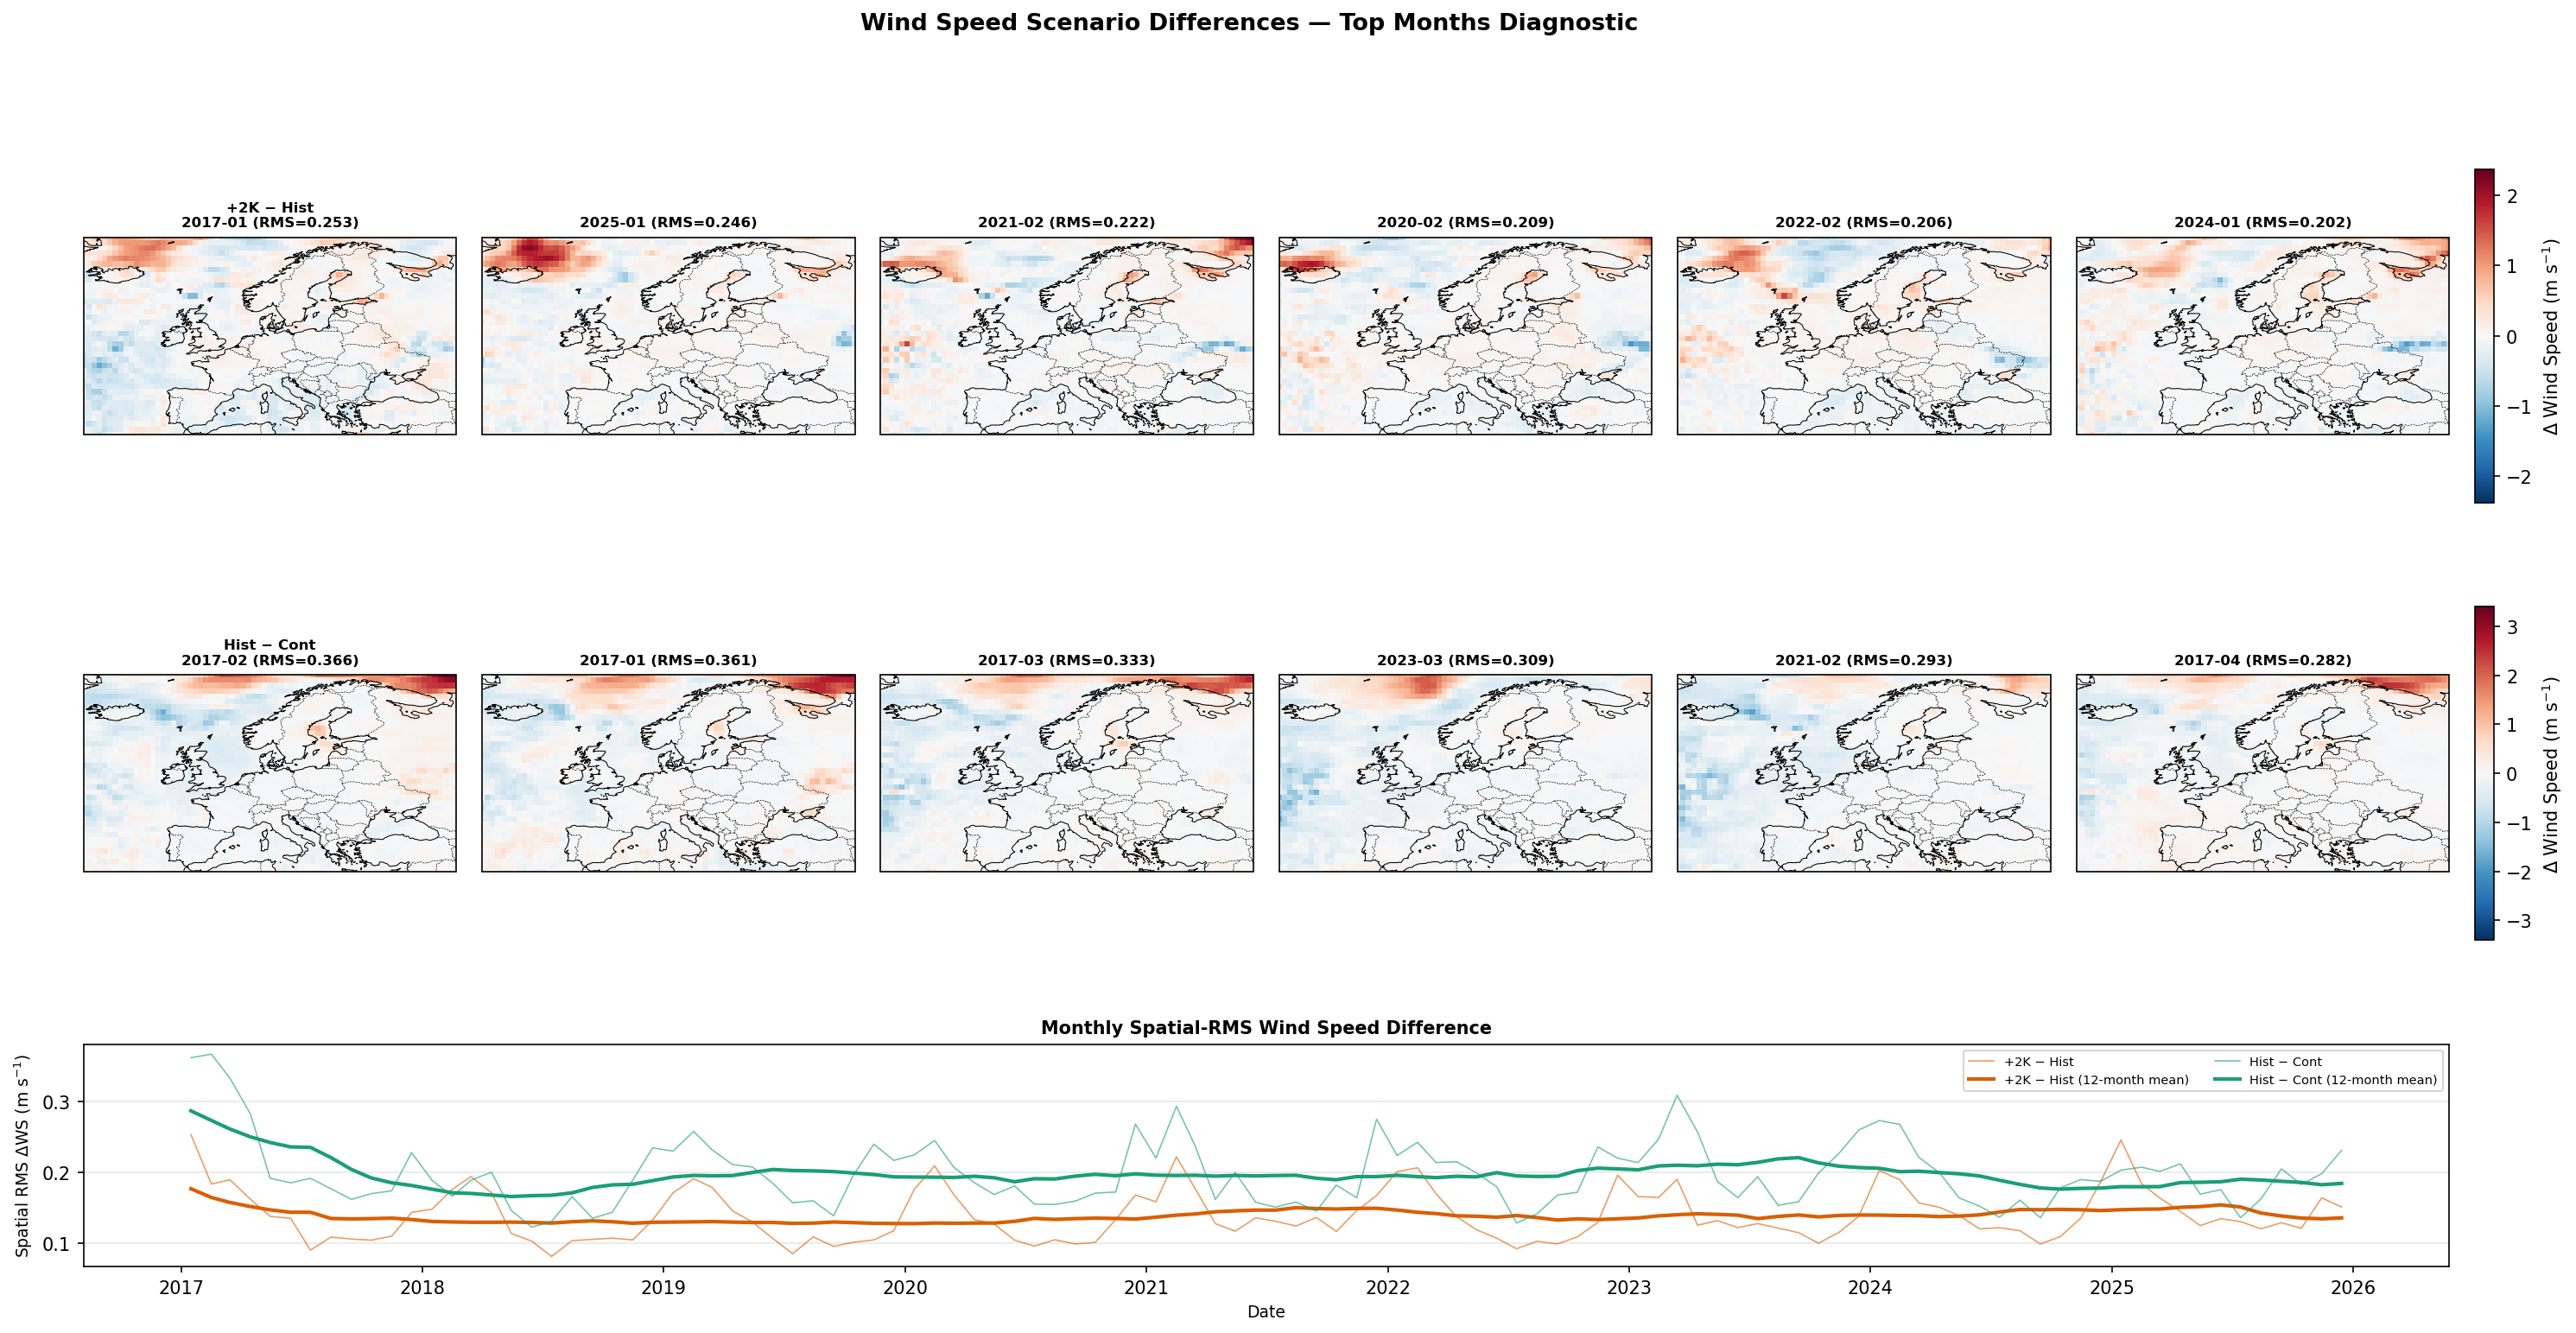
Diagnostic identifying the months and regions with the largest wind speed differences between scenarios. Shows the top-6 months by spatial-RMS difference for each scenario pair, plus a time series of monthly RMS differences with 12-month running means.